Polling 101 - Chapter One: Sample Sizes
From Marbles to Polls: The Interesting Math of 1000-Person Samples.
One of the things that goes along with election season is a proliferation of political polls, and with that; questions about how valid and reliable they are. Over the next few weeks, I’m going to address some of the frequently asked questions about political polls. Here’s the first:
Why do we only have polls of 1000 people? And can we trust them?
This is a very common question. It seems counter-intuitive to think that a group of only 1000 people can tell us about the whole population. But there is sound science behind it.
The Virtual Marble Experiment
Imagine a really big bucket holding a million marbles. 370,000 of the marbles are blue, and 630,000 are other colours. If we randomly pull out a marble, there is a 37% probability that it will be blue, and a 63% chance of it being some other colour.
If we took out 10 marbles, we’d expect 3 or 4 to be blue and 6 or 7 to be other colours. But it wouldn’t be surprising if the proportion was different.
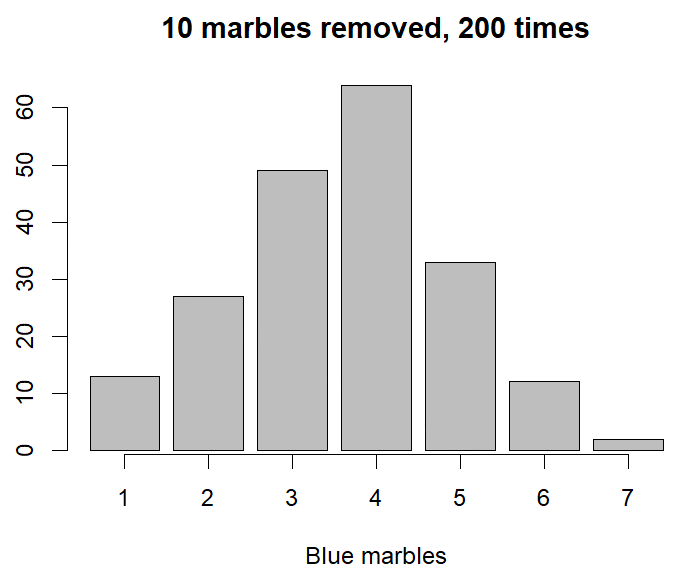
As a demo, I got my computer to take 10 virtual marbles out of a virtual bucket and record the results. After 200 goes, this was the result:
Most marble draws had 3 or 4 blue marbles in the set (113 times out of 200), but I had other results almost half the time too. And this is what we’d expect intuitively. If we roll 6 dice, we don’t expect to get exactly one of each number every time.
But what if I tried 100 marbles?
This time I have 175 of the 200 samples with between 31% and 43%. I’m starting to get a reasonable representation of the contents of the virtual bucket.
If I increased it again, I’d get closer and closer to getting it right. But I’d never be able to know if I had the perfect proportion.
The same thing goes with people. If we manage to randomly sample 10 people (which is very difficult, and part of a different explainer) we would expect that they might vaguely cover the political opinion of the country, but they also might not.
But if we increased the number of people, it would start to get closer to representing the actual number of people who held particular views.
Financial Constraints and Diminishing Returns in Large-scale Polling
But there’s a problem. It’s expensive to poll lots and lots of people. And it gets to a point where the added expense of adding in extra people adds next to nothing to the reliability of the poll.
Extending out the above example with 10 marbles and 100 marbles, I took samples of different sizes all the way from 10 to 5000 (again using my computer, not actually drawing 5000 marbles out of a giant bucket). It got these results.
Each dot is the percentage of blue marbles in the sample. The red line shows the middle 95% of the sample results. The green line is where the theoretical central 95% should be.
The wider the band, the less reliable the results. We can see that it gets more reliable as the sample size increases. But, interestingly, we can also see that after a while there isn’t a huge difference in reliability as we move along.
Balancing Cost, Accuracy, and Representation
To go from the green line being 5% either side to being 4% either side, we need to add 205 to our sample size. To go from 4% to 3%, we need to add 444. To go from 3% to 2% requires adding 1270.
A sample of roughly 2300 would be required to be 1% more accurate than a sample of 1000. That would cost more than double, and yet would only slightly improve the reliability of the results. And that’s a big part of why pollsters in New Zealand tend to have samples between 1000 and 1200 people.
Provided a poll is done correctly (and that’s a big if), a sample of 1000 is more than enough to get a good gauge of what the political leanings of the nation are.


